Magnetic Stability of
Oceanic Gabbros from ODP Hole 735B
H.-U. Worm
Magnon International, Am Burgberg 5, 37586 Dassel *
Abstract
Ocean Drilling Program (ODP) Hole 735B was drilled
to a depth of 1.5 km in a tectonic window of gabbroic lower oceanic crust created
at the Southwest Indian Ridge. The gabbros have a very stable natural remanent
magnetization (NRM) of reversed polarity with most unblocking temperatures
slightly below the Curie temperature of magnetite. The NRM includes a drilling
induced overprint but its intensity decays strongly towards the interior of the
drill core. The demagnetization data yield no or only very small secondary
magnetization component acquired during the present Brunhes chron or an earlier
normal chron, suggesting cooling through most of the blocking temperature range
during chron C5r and a strong resistance against the acquisition of
thermoviscous magnetization. A novel furnace has been designed to measure
magnetizations and their time dependences at high temperatures (up to 580°C)
inside a commercial SQUID magnetometer. Magnetic viscosity experiments have
been conducted on the gabbros at temperatures up to 550°C to determine the time
and temperature stability of remanent magnetization. Viscosities are generally
small and increase little with temperature below the main blocking temperature,
where the increase becomes almost an order of magnitude. Extrapolations to
geological times infer viscous acquisitions that would be 5 – 25% of a
thermoremanence in 100 k.y. and at temperatures of 200 – 500°C. At ocean bottom
temperature the predicted magnetization of one sample acquired in the present
Brunhes chron should be 10% of the NRM. However, this is not recognized during
NRM demagnetization and pTRM acquisitions at 250°C are also much smaller than
predicted. It thus appears that the NRMs are generally magnetically harder than
magnetizations acquired after heating to 570°C in the laboratory.
Susceptibility changes during heating are small (< 5%) indicating a
seemingly stable magneto-mineralogy, but conspicuous minima occur after heating
to 520°C. Also, quasi paleointensity experiments reveal characterestic patterns
in the NRM/pTRM ratios and also large increases in pTRM capacity after heating
to 570°C. Moreover, ARM acquisition in the low field range ( £ 10 mT) is strongly enhanced after heating by
factors up to three. The alteration of the magneto-mineralogy is interpreted to
result from the annealing of defects in magnetite that originate from
tectonically induced strain. The oceanic gabbros of Hole 735B are thus ideal
source layer material for marine magnetic anomalies, and secondary
thermoviscous acquisition, as a possible cause for anomalous skewness, is
essentially absent.
Keywords: Rock Magnetism, Magnetite, Magnetic Viscosity, Oceanic Crust, Crustal
Magnetization.
1.
Introduction
The vertical structure of the sources of lineated marine
magnetic anomalies have remained poorly known ever since the recognition, more
than 30 yr ago, that the ocean crust records reversals of the geomagnetic
field. Inferences on the magnetization of lower crustal rocks from studies of
dredged rocks [1,2] are ambiguous because these surficial samples have been
subjected to varying degrees of seawater alteration that may have significantly
affected the magnetic properties. The first long in situ section of gabbros was
recovered in 1987 during ODP Leg 118. During this leg, Hole 735B was drilled to
505 meters below sea floor (mbsf) in a tectonic window at the Southwest Indian
Ridge where lower crustal rocks are exposed [3]. Hole 735B was reoccupied in
1997 during Leg 176 and deepened to 1508 mbsf [4, 5].
During the
site survey for Leg 118 [6], sea surface magnetic anomalies were mapped over
large regions of the rift mountains of the Southwest Indian Ridge adjacent to
the transform fault. Extensive dredging of these regions, including Atlantis
Bank, recovered largely gabbro and peridotite, suggesting that these
lithologies must be responsible for the anomalies [6], a possibility first
raised by the laboratory work of Fox and Opdyke [1] and Kent et al. [2]. The
hypothesis that gabbro could be a major contributor to the magnetic anomaly over Site 735 was
confirmed by direct measurements
on cores [7-9]. With the addition of the
Leg 176 cores, however, it now
appears that the 1.5-km Hole 735B gabbro section is the principal source of the lineated magnetic
anomaly over the site, to the extent
that this section is representative of the crust in three dimensions.
This
study focusses on the thermoviscous properties of the gabbros, i.e. the
magnetic stability of remanent magnetization with time and temperature. This is
of importance with regard to the maximum possible temperature and depth of the
sources of marine magnetic anomalies and their anomalous skewness [10, 11]. The
more general paleomagnetic results obtained for Leg 176 samples are published
in a separate paper [12].
2.
Rock Magnetism
Pure or nearly pure magnetite has been found as the sole magnetic
carrier of remanence in Hole 735B rocks [3, 4, 9]. Thermomagnetic curves on
more than 30 Leg 176 samples have been measured in the laboratory Grubenhagen
(GGA, Germany), with a Curie balance (in vaccum and a field of 0.55 T). All
curves show Curie temperatures very
close to that of pure magnetite (Tc = 577°C) and nearly all curves
are reversible to within 5% of the initial magnetization, indicating the
absence of significant maghemitization, the low temperature oxidation of
magnetite.
Hysteresis loops have been measured on 40 samples at the ‘Institute of
Rock Magnetism‘ at the University of Minnesota with a vibrating sample
magnetometer in applied fields of up to 1 Tesla. Samples were taken as bulk
samples with volumes of typically 6 cm³, because subsamples may not be
represantative for the generally coarse-grained gabbros. The hysteresis
parameters coercivity, Hc(average) = 13.9 ± 4.7
mT, coercivity of remanence, Hcr(average) =
29.9 ± 6.9
mT, and the ratio of saturation remanence over saturation magnetization, Mrs/Ms(average)
= 0.22 ± 0.07, indicate pseudo-single domain behavior for practically all
samples despite a significant range in magnetite grain sizes [4, 5].
The hysteresis parameters confirm that the gabbros are well capable of
preserving a paleomagnetic signal.
The frequency-dependence
of susceptibility Xfd has been determined for all samples described
in sections 3 & 4 with a Bartington instruments in order to determine
whether the magnetite grain size range extends into the superparamagnetic (SP)
regime. However, for all samples is Xfd < 0.5% within the
resolution limit of the instrument. Therefore it can be concluded that grains
with sizes around 10 – 20 nm are essentially absent [13].
Susceptibility variations
during thermal demagnetization have routinely been measured after each heating
step of the later described quasi-paleointensity measurements in order to
monitor possible changes in the magneto-mineralogy. Changes are generally less
than 3% and at first, this was considered to indicate very stable magnetic
phases. There are, however, small but very distinct changes with a minimum at
520° - 540°C and a sharp subsequent increase (Fig. 1), suggesting a common
mineralogical cause.
The acquisition of
anhysteretic remanent magnetization (ARM) has been measured twice on several
samples, the first following alternating field demagnetization of NRM and the
second following a subsequent heating to 580°C, because during the evaluation
of the viscosity experiments the suspicion arose that remanence acquisition
becomes enhanced after heating. The results indeed show always a signifiantly
increased ARM acquisition after heating in the low field range (£ 10 mT) with factors up to three at 2.5 mT,
while the final ARMs show little changes. It was also noted that
susceptibilities always increased from before the first ARM acquisition (which
was > 6 months after NRM af demagnetization) to values being 2 – 4 % higher
after acquisition. Further on, susceptibilities were increased by 0 – 4 % by
heating to 580°C, but decreased subsequently by 3 – 5 % after the final ARM.
3.
Paleomagnetism
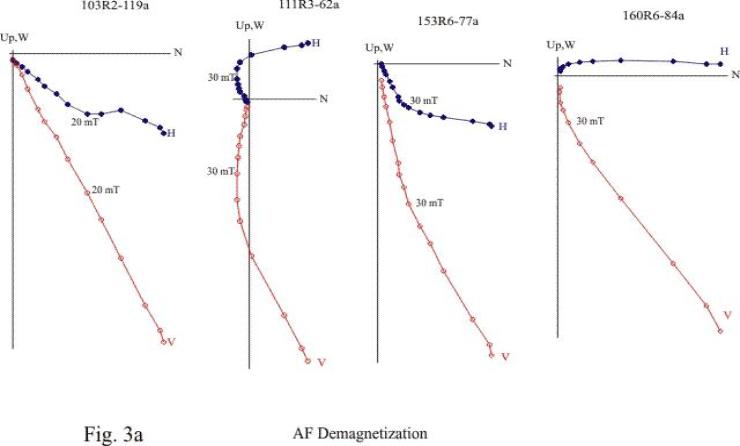
Paleomagnetic
analyses of Leg 176 gabbros on the basis of alternating field and thermal
demagnetizations have revealed a radially directed drilling induced magnetic
remanence (DIRM) of the drill core in addition to the primary paleomagnetic
reversed component magnetization [4]. While the drill core is azimuthally
unoriented the samples’ coordinates refer to the split core plane in the sense
that north points horizontally outward. The standard inch-sized samples studied
in Grubenhagen were cut in half to give an inner and outer approx. 1.2 cm long
cylinder. For the outer specimens the DIRM is mostly strong and noticable as a
northerly component and requires 20 to >30 mT alternating fields for its
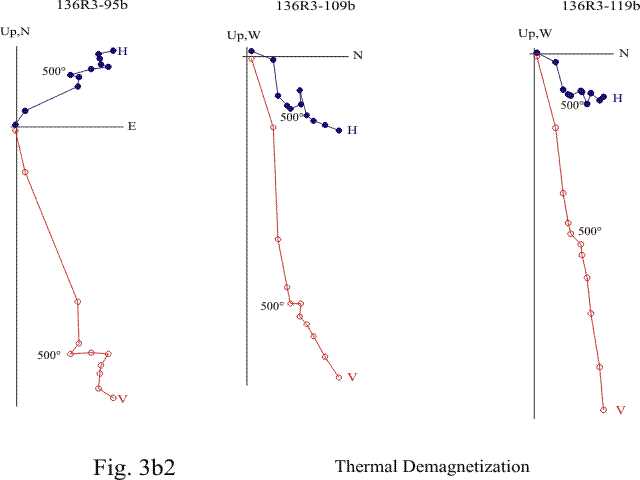
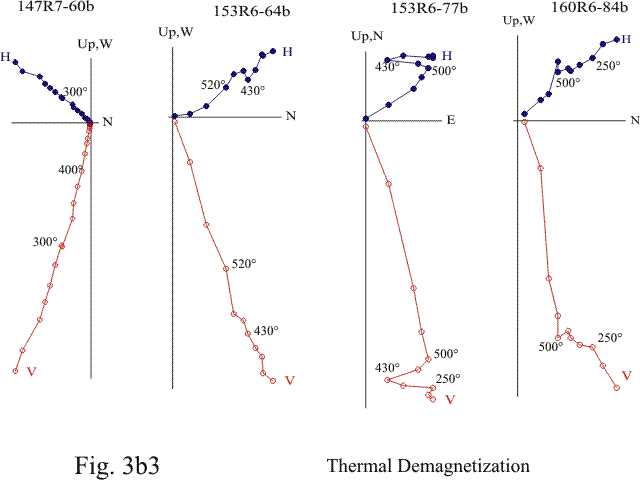
demagnetization (Fig. 3a). However, the radial overprint decreases strongly
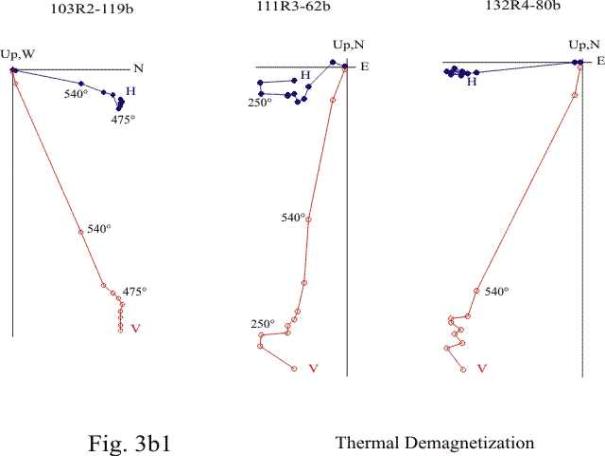
from the rim towards the center of the drill core. The samples selected for
thermal experiments in this study are the inner halves, and they possess no or
only minor secondary components (Fig. 3b). For all shown samples, except
147R7-60 cm, each demagnetization was followed by a pTRM acquisition (next
section) at the same temperature. And if the pTRMs were not completely erased
at the next higher demagnetization temperature, then the depicted curves do not
represent solely the NRM demagnetization. Sample 147R7-60cm has been
continuously thermally demagnetized. The normalized intensity decay curves
(Fig. 3c) show that for most samples 80% of the NRM is blocked up to 500°C.
Sample 136R3-119 shows 50% unblocking at 500°C but this sample carries also a
significant northerly DIRM component and the measured unblocking spectrum is
thus not equal to that of an undisturbed NRM. For most samples the NRM
intensity remaining after 540°C demagnetization is still > 50% of the
initial NRM.
4.
Remanence Acquisition and Intensity
The
gabbros contain primary magmatic magnetite which is expected to carry a primary
thermoremanent magnetization (TRM) [4, 9]. However, secondary magnetite formed
during the alteration of olivine and pyroxenes at temperatures above and possibly
also below the Curie temperature of magnetite [7, 12]. A fraction of the NRM
may thus constitute a chemical remanent magnetization (CRM) that could record a
different field direction than the TRM if acquired at a later stage.
Eleven
samples were selected for partial thermoremanent magnetizations (pTRM)
experiments. Eight of the samples are pairs or triples, respectively, from long
unbroken core pieces. pTRMs were imparted following each demagnetization level,
as in Thellier-like paleointensity determinations. The purpose was to see if
the pTRM measurements yield estimates of the same field intensities for each of
the chosen temperature intervals among samples, or different intensities for
subsequent intervals. Also, a CRM may be recognized by very different NRM/pTRM
ratios above and below the mineral growth temperature.
For pTRM acquisition the samples‘ NRM direction was aligned with the
oven’s field direction as well as possible, to 5 – 20°. This was important
because of the mostly large magnetic anisotropy.
The ratio of a TRM parallel kmax to the TRM parallel kmin
was > 2 for some samples.
Results
are displayed as Arai plots in figure 4, where each point represents a
temperature and the gained pTRM intensity is plotted versus the demagnetized
NRM. If a sample had cooled over the whole temperature range in the same field
intensity and no alteration occured, then all points would lie on a straight
line. The slope would be given by the ratio of paleofield to laboratory field
(40 µT) intensities (to be corrected for different paleo- and laboratory
cooling rates).
A
different view of the same data as in figure 4 is shown in figure 5, where the
ratios of pTRMs gained to NRMs lost in distinct temperature intervals are
depicted. The symbols at 250°C represent
the ratios of pTRMs gained in the interval 25° - 250°C to the NRM demagnetized
in the same interval, both normalized to the initial NRM.
A
general feature is the observation that the curves can be separated into two
segments, one up to ~500°C
where the intensity of the pTRM gained is mostly smaller than the NRM fraction
lost, and the interval above where the gained pTRM is always much larger than the demagnetized NRM fraction. Up to
250°C the pTRM/NRM ratios are typically < 10% (Fig. 5). At 350°C typically
10 – 20% of the NRM gets demagnetized but only 2-3% of the NRM intensity is
gained during pTRM acquisition at the same temperature (with the exception of
153R6) (Fig. 4). There are conspicuous minima
in the pTRM/NRM ratios for several samples at 500°C, that are sometimes
even negative. Negative values are caused by a decreased pTRM intensities
despite an increased acquisition temperature, being most notable for the 153R6
samples. For the 350°-450° interval neighboring samples (136R3, 160R6) have apparently
similar pTRM/NRM ratios (Fig. 5), but even here the scatter is much larger than
expected for a reliable paleointensity determination; the ratio ranges from
0.35 to 0.63 for the 136R3 samples.
The
pTRM checks (570° → 500°) (Fig. 4) are evidence for large increases in
pTRM capacity presumably due to magneto-mineralogical changes, which are also
indicated by the conspicuous susceptibility changes at and above 500°C (Fig.
1).
5.
Thermoviscous Properties
5.1 Background
and Theory
One
of the important and still open questions regarding the sources of marine
magnetic anomalies is that for the stability of magnetic remanence with time
and temperature. So far the evidence is mostly indirect. In this case we know
that the gabbros of Hole 735B preserved a stable remanence of reversed polarity
for more than 11 million years. Little is known, however, about the cooling
history of the drilled section, and the question for the rate of viscous
acquisition of magnetization at a given temperature can only be answered by
experiments.
In nature, the gabbro’s magnetization was in equilibrium
with the paleomagnetic field upon cooling below the Curie temperature. Then, at
a later stage associated with an unknown lower temperature the field reversed
its polarity and the magnetization attempted to re-equilibrate with the
external field, expressed as thermoviscous changes in magnetization. Since we
haven’t observed clear evidence for opposite remanence components, it may be
assumed that the temperature at the time of the next field reversal had dropped
to a value where viscous changes are so small that the reversed component was
not recorded.
The purpose of the following experiments is to determine
the rate of viscous magnetization acquisition and its temperature dependence.
Ideally, measurements should take place in a reversed
field at a constant temperature after a primary pTRM has been acquired during
cooling from Tc . However, measuring viscosity in a field is
disadvantadgeous for two main reasons:
1)
The SQUID Sensors measure the
magnetic flux originating from the stray field of the sample‘s magnetic moment
as well as the applied field itself, and because it is practically impossible
to stabilize the dc field to << 10-4, the small viscous
changes may be undetectable due to dc fluctuations.
2)
The magnetic mineralogy
undergoes alterations, subtly even after multiple heatings, and newly formed
phases will acquire a CRM in an applied field. The CRM would obscure the purely
viscous changes towards seemingly larger values.
It is argued that viscous changes following a pTRM
acquisition by cooling from Tc to To in a field of
intensity +H and a field reversal from +H to –H are very similar, if not equal,
to viscous decay in zero field following a pTRM(Tc → To)
acquisition in +2H (Fig. 6).
Viscous magnetization is the approach from a
non-equilibrium towards the equilibrium magnetization. Based on Néel’s SD
theory viscosity can be expressed as [e.g. 14, 15]:
M(t) = ò [Meq –
(Meq – Mo) ´ e -t/t ] N(t) dt (1)
M(t) is the time dependent magnetization, Meq
the equilibrium magnetization, Mo the initial magnetization, t a relaxation time, and N(t) its distribution function.
In the case of figure 6a it is assumed that the sample
has been cooled from above Tc in a field of intensity 1 to a
constant temperature to acquire a magnetization (TRM) of intensiy 1, which is Mo
in equation 1. Upon the field reversal at time to the magnetization attempts
re-equilibration towards Meq (» - Mo).
The difference in the case of figure 6b is that the
initial TRM is double in intensity (acquired in a field of intensity 2) and that the new equilibrium magnetization
is Meq = 0.
Equation 1 thus becomes:
M(t) = ò Mo [-1 + 2 ´ e -t/t ] N(t) dt (2a)
or :
M(t)
= ò Mo [2 ´ e -t/t ] N(t) dt (2b)
which predict that initial and final intensities are different but the
rates of change to be identical. The latter is not strictly true because the
relaxation time t itself is field dependent [15], but for external fields
H << Hc, the coercivity, differences
are negligible.
5.2 Experimental
Setup
The employed magnetometer is a commercial SQUID
magnetometer (SRM 755 by 2G) located in the laboratory Grubenhagen, modified
and equipped with an electric furnace that holds a sample of 1 inch diameter and
allows heating while measuring up to a temperature of 580°C while the
temperature is constant to < 0.5°C. Achieving this goal was not simple and
to our knowledge it has not been accomplished in any other paleomagnetic lab
before.
The main problem to circumvent is produced by the
current of the heating wires because currents generate magnetic fields easily
much larger in amplitude than the stray field of the samples under study. The
solution has been achieved by employing high frequency currents whose secondary
magnetic fields were shielded by an aluminum tube. The furnace itself is a
quartz tube on which platinum wire is wound non-inductively. Measurements are
performed without moving the sample out of the furnace and without switching it
off.
The measuring scheme has been the following: The sample
(25 mm diameter, ~12 mm length) was demagnetized by heating inside the
magnetometer and in zero field (i.e. < 20 nT) to 580°C. Then, the sample was
cooled in a field (typically 25 to 70 µT) produced by a coil located in the
front part of the magnetometer to a temperature of 550°C and thermal
equilibrium was awaited for 15 min.. The field was switched off and the viscous
magnetization decay was measured for periods up to 1200 s. For the next
viscosity measurement the sample was reheated to 580°C, cooled to 525°C in
field, equilibrated, and measured as before. For lower temperatures the sample
was only reheated to the next higher previous measurement temperature.
5.3 Results
For the three samples under study viscous changes are
generally linear on a log time scale. Results are shown in figure 7. Hence,
viscosity can conveniently be characterized by a viscosity coefficient S:
VRM
= Mo - S log t (3)
For comparing viscosities at different temperatures, in order to predict
times in which the initial magnetization has decreased to a certain percentage,
the viscosity coefficient S is normalized by the magnetization reached 10 s
after field removal Mo(10 s). The temperature dependence of S is
displayed in figure 8 and tabulated in Table 1.
6.
Discussion and Conclusions
The
gabbros possess very stable NRMs of reversed polarity with no clear normal
component during thermal demagnetization for any temperature interval. The
single component NRM suggests that the whole gabbroic section cooled through
the blocking temperatures from ~570°C to near ambient in a single geomagnetic
polarity interval, the reversed chron between C5An.1n and C5r.2n [13].
The
viscosity experiments have been conducted in an attempt to quantify viscous
overprints and their temperature dependences. Viscosities increases generally
little with increasing temperature up to 500°C (Fig. 8), but strongly above
520°C towards the main unblocking temperature. For one sample (Fig.7d) viscous
changes deviate from the otherwise observed linear log(t) behavior with a kink
in the curve. This may be due to the proximity of the main blocking
temperature. From the viscosity coefficients of table 1 it is not immediately
apparent how much viscous overprint can be acquired in time intervals typical
for the duration of polarity chrons – and provided the extrapolation from
laboratory times is justifyable. Assuming the latter, figure 9 shows how the
experimental results are extrapolated up to > 100 k.y. for two temperatures.
For sample 103R2-119cm, the sample with the highest Q-factor, the changes are
the smallest among the three samples. Still, the viscous component acquired
during the present Bruhnes chron should amount to around 5% of the TRM, while
assuming that the viscosity at ambient temperatures is similar to the viscosity
at 200°C, as is true for 147R7-60cm (Table 1). The viscosity of 147R7-60cm is only slightly higher, but more
pronounced for 153R6-64cm. Still, even at 500°C and in time periods up to 1
m.y., viscous changes would not overwrite the primary TRM polarity.
As
long as the cooling history of the gabbroic lower crustal section is poorly
known, the thermoviscous components of earlier polarity chrons cannot be
infered, but for the Bruhnes chron the extrapolated results at 20°C can be
compared to the NRM demag components. The extrapolated viscosity results
predict that 5 to ~20% of
the NRM should be parallel to the present normal polarity field. However this
is not the case. For the three samples (Fig. 3b), and for almost all studied
735B samples [13], there is no recognizable recent field component. While it
can be argued that a drilling induced magnetization may hide the ‘soft‘ ambient
component for 103R2-119cm, the other two samples behave nearly uni-vectorial.
Hence
the question arises whether it is illegetimate to extrapolate viscosity results
from laboratory to geological time scales. While this cannot be ruled out,
there is also evidence for severe magneto-mineralogical alteration associated
with heating of the gabbros above ~500°C. The subtle change in susceptibilities
(Fig. 1) may at first not appear as very significant, however the distinct
minima at 520°C suggest a common cause. A re-examination of previous
susceptibility changes during shipboard thermal demagnetizations shows that for
most samples a similar minimum at 520°C occured, but it is sometimes not
apparent due to larger overall changes. The pTRM checks (Fig. 4) of the
quasi-paleointensity experiments indicate huge changes in pTRM capacity
following heating to 570°C. Moreover, the distinct pattern of pTRM/NRM ratios
(Fig. 5) with minima at 500°C for some samples and large increases above 500°
further supports the notion of a common mineralogical cause.
The
negative pTRM/NRM ratios at 500°C (Fig. 5) are hard to comprehend as the
decreased pTRM intensity despite an increased acquisition temperature is
against common pTRM models. Without further examination it can only be
speculated that magnetostatic interactions between grains with different
blocking temperatures are responsible for this phenomenon.
On
the basis of large increases of the pTRM/NRM ratios above 500°C alone, it could
be suspected that a magnetite formation temperature Tf well below
the Curie temperature is responsible for this increase, because magnetite
formed below Tc carries a chemical remanence similar to a pTRM(Tf)
and lower in intensity than a TRM. However, this would imply that the majority
of magnetite grains in all samples formed at rather low temperatures, an
implication that appears incompatible with petrographic studies [4, 9, 16],
albeit the studies state that some of the secondary magnetite may have formed
below Tc.
The
ARM acquisition measurements prior to and after heating, respectively, show that remanence acquisition in small fields
is suppressed in the unheated state compared to after heating (Fig. 2). This is
interpreted to be due to defect-pinned domain walls of multidomain grains in
the initial state, while the domain walls become more mobile by heating due to
annealing of the defects. Similarly, the isothermal increase of susceptibility
caused by the initial ARM acquisition may also be regarded as evidence for an
effect of defects.
It
is speculated here that the cause for the changes in magnetic properties is the
defect structure of magnetite which presumably formed by strain. In their
petrographic study on Hole 735B gabbros Pariso & Johnson [9] describe
strained ilmenite but were unable to confirm the finding for magnetite because
of its isotropic optical properties. However, in an SEM study on Leg 176
samples Trimby [17] observed defect structures in magnetite attributed to
strain. All viscosity experiments have been performed after multiple heatings
to Tc and presumably annealing of the defects, thus ‘softening’ the
magnetic properties. Viscous acquisition in nature during the past 800 k.y. may
thus have been much ‘harder‘ than during the experiments in the lab.
The
viscosities extrapolated to geological times can be compared to the NRM
fraction demagnetized at 250°C but also to the pTRM gained at this temperature,
because the time-temperature relationship of Néel’s SD theory predicts that
aproximately equal intensities are acquired at 10 - 20°C in 800 k.y. and at
250°C in 10 minutes [15]. NRM demagnetization and pTRM acquisition (Fig. 3 – 5)
are consistent in the sense that no discernable Brunhes component is recognized
and hardly any pTRM is gained by 250°C. The reason the viscosity experiments
predict much larger recent components most likely results from the alteration of
the magnetic properties preceding the viscosity measurements.
The
magneto-mineralogical alteration occuring during heating above ~500°C limits
possible paleointensity determinations to the data gained below 500°C. However, the dissimilar pTRM/NRM ratios even
for neighboring samples in the 250° - 430°C interval indicates that no reliable
paleointensity information can be gained from these gabbros.
Viscosity experiments on gabbros from the upper 500 m of Hole 735B have
also been conducted in a study by Bowles & Johnson [18]. The main
differences between their and this experimental setups are: (i) the thermally
demagnetized state of their samples before viscous acquisition opposed to TRM
here, (ii) in-field (1.5 Oe) opposed to zero field measurements, and (iii)
fluxgate versus SQUID magnetization sensors. The Bowles & Johnson results
appear to be in disagreement with our experiments in several aspects. First,
while we observe viscous changes that behave linear on a log time scale, their
magnetization curves are concave up on a log-t scale. Secondly, while we find
slight increases of viscosity up to 500°C and a large increase above, Bowles
& Johnson report a maximum viscosity for T = 250°C, and nearly
indistinguishable viscous acquisitions at 350°, 450° and 525°C. This holds true
when absolute magnetization values are compared, but when these are normalized
to saturation magnetization at the respective temperatures viscosity of the
Bowles & Johnson experiments is also largest at the highest temperature. Hence,
as far as the temperature dependence is concerned our results are not that
different from Bowles & Johnsons‘.
The non-linear behavior on a log time scale prohibits extrapolations to
geological times because it would result in values exceeding by far the NRM
intensity. Therefore, Bowles & Johnson [18] receded to using a hyperbolic
tangent data fit that yields an asymptotic maximum VRM which is around 25% of
the NRM intensity. However, 82 -99% of this hypothetical maximum VRM would
already be reached within only one month and at 250°C.
In contrast, the shapes of
the viscosity curves and the rates of acquisition of this study are
fundamentally different. While we predict viscous components to reach 5 to 20%
(depending on sample) of the TRM in > 105 years and at 200°C, the
Bowles & Johnson paper infers 20% acquisition in only one month – and very
little changes thereafter. If true, the latter VRM would act like an induced
magnetization because of its nearly instantaneous acquisition on a geological
time scale.
The contradicting results
can be compared to the measured NRMs and its VRM components in particular. As
stated earlier, secondary field components, aside from DIRMs, are generally
absent. Viscous components are thus even much smaller than predicted by extrapolations
of this study and much more in disagreement with the Bowles & Johnson
inference.
We attribute this behavior to magnetically ‘harder’ NRMs than
laboratory TRMs. Strain-induced defects in the magnetite crystals are
presumably responsible for the hard NRM resisting VRM acquisition in nature.
Upon heating above ~500°C in the laboratory the defects
have been annealed and viscosity is more easily acquired than in nature.
The detection of a
strain-hardened magnetization reopens the question for the timing of the
remanence acquisition. Whether the gabbros did indeed cool from the Curie
temperature to near ambient within a single polarity chron because that is what
the single component of reversed polarity suggests, or if the introduced strain
‘froze’ the initially acquired remanence at some temperature below 500°C (as
the upper limit) with little additional remanence acquisition upon further
cooling.
In
any case it must be concluded that the gabbros‘ magnetizations are extremely
stable and that they preserved only the primary field direction - aside from
the drilling induced component. Even after reheating and annealing of the
defects viscous acquisition at temperatures up to 500°C and in time periods up
to > 100 k.y. accounts for less than 5 – 25% of a thermoremanence. The
gabbros thus constitute ideal sources for marine magnetic anomalies.
Acknowledgements. This research used samples provided by the
Ocean Drilling Program (ODP). ODP is sponsored by the U.S. National Science
Foundation (NSF) and participating countries under management of Joint
Oceanographic Institutions (JOI), Inc. Funding for this research was provided
by the Deutsche Forschungsgemeinschaft (DFG). Comments by Jeff Gee and the
reviewers Paul Kelso and Bruce Moskowitz led to significant improvements of the
manuscript.
References
[1] P.J.
Fox and N.D. Opdyke, Geology of the oceanic crust: magnetic properties of
oceanic rocks, J. Geophys. Res., 78,
5139–5154, 1973.
[2] D.V. Kent, B.M. Honnorez, N.D. Opdyke and
P.J. Fox, Magnetic properties of dredged oceanic gabbros and source of marine
magnetic anomalies, Geophys. J. R.
Astron. Soc., 55, 513–537, 1978.
[3] P.T. Robinson, R. Von Herzen, et al.,
Proceedings of the Ocean Drilling Program, Initial Reports Leg 118, 826 pp.,
Ocean Drilling Program, College Station, TX, 1989.
[4] H.J.B. Dick, J.H. Natland, D.J. Miller et
al., Proceedings of the Ocean Drilling Program, Initial Reports [CD-ROM] 176,
1999.
[5] H.J.B. Dick et al., A long in situ section of the lower oceanic
crust: Results of ODP Leg 176 Drilling at the Southwest Indian Ridge, Earth
Planet. Sci. Lett., 2000.
[6] Dick, H.J.B., Schouten, H., Meyer, P.S.,
Gallo, D.G., Bergh, H., Tyce, R., Patriat, P., Johnson, K.T.M., Snow, J., and
Fisher, A., Tectonic evolution of the Atlantis II Fracture Zone. In Von Herzen, R.P., Robinson,
P.T., et al., Proc. ODP, Sci. Results, 118:
College Station, TX (Ocean Drilling Program), 359–398, 1991.
[7] E.
Kikawa and J.E. Pariso, Magnetic properties of gabbros from Ocean Drilling
Progran Hole 735B at the Southwest Indian Ridge, Proceedings
of the Ocean Drilling Program, Sci. Results, Volume 148, College Station, TX,
285-307, 1991.
[8] E. Kikawa and K. Ozawa, Contribution of
oceanic gabbros to sea-floor spreading magnetic anomalies, Science, 258,
796-799, 1992.
[9] J.E. Pariso and H.P. Johnson, Do lower
crustal rocks record reversals of the Earth's magnetic field? Magnetic
petrology of gabbros from Ocean Drilling Program Hole 735B. J. Geophys. Res., 98,16013–16032, 1993.
[10] S.C.
Cande & D.V. Kent, Constraints imposed by the shape of marine magnetic
anomalies on the magnetic source, J. Geophys. Res., 81, 4157-4162, 1976.
[11] J. Dyment and J. Arkani-Hamed,
Spreading-rate dependent magnetization of the oceanic lithosphere inferred from
the anomalous skewness of marine magnetic anomalies, Geophys. J. Int., 121,
789-804, 1995.
[12] J. Gee and H.-U. Worm, Paleomagnetism of
ODP Leg 176 gabbros, in preparation.
[13] H.-U. Worm, On the superparamagnetic-stable
single domain transition for magnetite, and frequency dependence of
susceptibility, Geophys. J. Int., 133, 201-206, 1998.
[14] H.-U. Worm, M. Jackson, P. Kelso and S.K.
Banerjee, Thermal demagnetization of partial thermoremanent magnetization, J.
Geophys. Res., 93, 12196-12204, 1988.
[15] D.J. Dunlop and Ö. Özdemir, Rock Magnetism, Cambridge
University Press, 1997.
[16] D. Stakes, C. Mevel, M. Cannat and T.
Chaput, Metamorphic stratigraphy of Hole 735B, . In Von Herzen, R.P., Robinson, P.T., et al., Proc. ODP, Sci. Results, 118: College Station, TX (Ocean Drilling Program), 153–180, 1991.
[17] P. Trimby, personal communication, Leg 176
post-cruise meeting, 1999.
[18] J.A. Bowles and H.P. Johnson, Behavior of
crustal magnetization at high temperatures: Viscous magnetization and the
marine magnetic source layer, Geophys. Res. Lett., 26, 2279-2282, 1999.
Table 1: Viscosity
coefficients at various temperatures of three samples from Hole 735B.
|
Sample |
103R2, 119 cm |
147R7, 60 cm |
153R6, 64 cm |
|
NRM [A/m] |
3.86 |
8.16 |
5.08 |
|
Q-Factor |
22.8 |
6.0 |
5.4 |
|
S (550°C) / M(10 s) |
0.01, 0.1 |
0.018 |
0.018 (50 µT) 0.020 (25 µT) |
|
S (525°C) / M(10 s) |
0.014 |
- |
0.012 |
|
S (500°C) / M(10 s) |
0.0063 |
0.0044 |
0.0056 |
|
S (450°C) / M(10 s) |
- |
0.0030 |
- |
|
S (400°C) / M(10 s) |
0.0023 |
0.0038 |
0.0029 |
|
S (300°C) / M(10 s) |
0.0017 |
0.0051 |
0.0034 |
|
S (200°C) / M(10 s) |
0.0014 |
0.0019 |
0.0040 |
|
S (120°C) / M(10 s) |
- |
0.0020 |
- |
|
S (25°C) / M(10 s) |
|
0.0013 |
|
Natural remanent
magnetization NRM, Q-factor = ratio of remanent to induced magnetization, and
viscosity coefficients S at temperatures between 20° and 550°C normalized by
initial magnetization at 10 s after field removal M(10 s).
Figures
Fig. 1: Susceptibility (κ) changes during stepwise
thermal demagnetization measured at room temperature and normalized to initial
value (κo). Heating times were 10 minutes for each temperature.
Fig. 2: Acquisition of anhysteretic remanent
magnetization (ARM) following more than 6 months after alternating field
demagnetization of NRM (·) and after heating to 580°C for 10 min.
(▲). Low field ARMs are always enhanced after heating.
c)
Fig. 3: Alternating field (a) and thermal
demagnetization of NRMs (b), displayed as orthogonal vector plots (a, b), where
H is the horizontal component and V the vertical. Normalized intensity decay of
thermal samples is shown in c). Samples a are from the rim and carry a
mostly strong northerly, drilling induced overprint. Only the inner samples b
were thermally demagnetized and here secondary components are much
smaller.Sample 147R7-60cm was continuously thermally demagnetized.
Fig. 4: Quasi paleointensity determinations by NRM
demagnetization versus pTRM acquisition. Samples were stepwise thermally
demagnetized and each demagnetization was followed by a pTRM acquisition. Each
point represents the NRM lost versus the pTRM gained for a certain temperature,
both normalized to the initial NRM value. Triangles represent pTRM checks at
500°C following demagnetization at 570°C.
Fig. 5: The ratios of pTRM gained to NRM lost for
subsequent temperature intervals. The same data as in figure 4. A symbol at
250°C depicts the interval 25° - 250°, at 350° the interval 250° - 350°, and so
on. Negative ratios result from decreased pTRM intensities at increased
acquisition temperatures.
Fig. 6: Model for viscous magnetization changes (solid line) following a field change (dashed line) from +1 to –1 where the magnetization is a TRM acquired in a field of intensity 1 (a), compared to changes following a field removal from +2 to 0 where the magnetization is a TRM acquired in a field of intensity 2 (b).
Fig. 7: Viscous changes with time (t) of the
magnetization (M) following the field removal in which the samples acquired a
TRM by cooling from the Curie temperature.
Fig. 8: Viscosity coefficients S (eq. 3 & figure 7)
normalized by initial magnetization at 10 s for samples 103R2-119cm (n), 147R7-60cm (l) and 153R6-64cm (u).
Fig. 9: Extrapolation of viscous magnetization
from the laboratory experiments (Fig. 7) to geological time scales.